Service state at a glance
Each customer-facing service is a tile. Green means clear. Red means an open incident needs attention.
Monitoring command center for MSP operations
A clean service-health dashboard for teams that need customer deployments, incidents, checks, and alert routing visible without turning the wallboard into noise.
Built for the room where incidents get fixed
XodeLens is designed around the operational goal of a clean wallboard. When something turns red, engineers can move straight from service state to checks and incident detail.
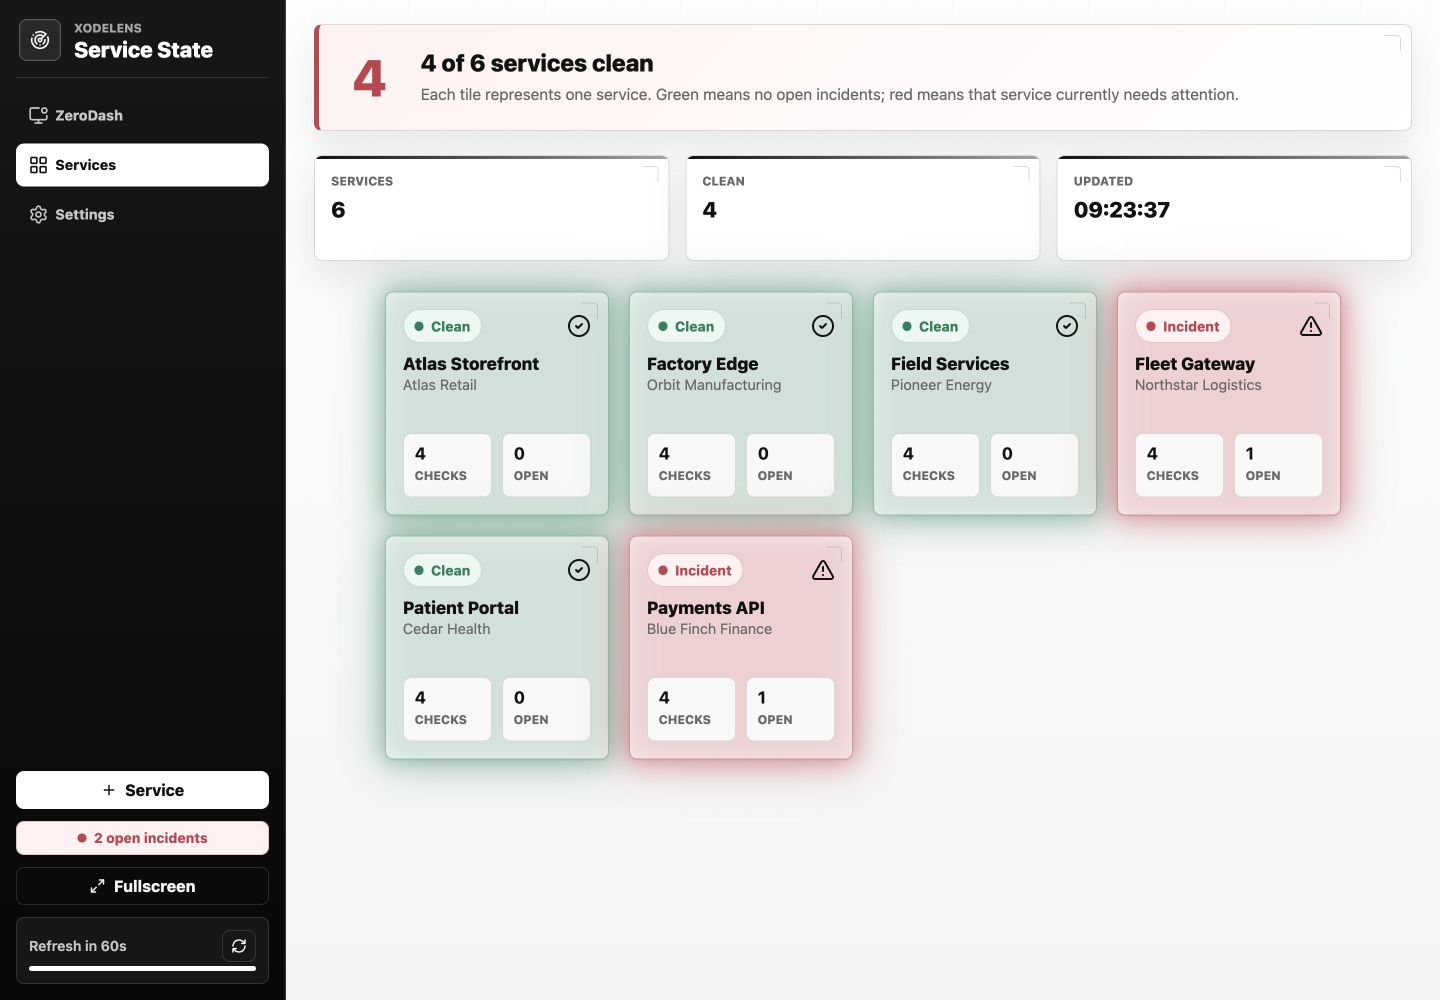
Each customer-facing service is a tile. Green means clear. Red means an open incident needs attention.
Track DNS, ICMP ping, HTTP status, and SSL certificate checks without exposing implementation detail on the wall.
Send incident and optional resolution alerts to Telegram, email, and webhook integrations such as helpdesk APIs.
Create services, checks, and integrations in authenticated views while keeping the public site separate.
ZeroDash
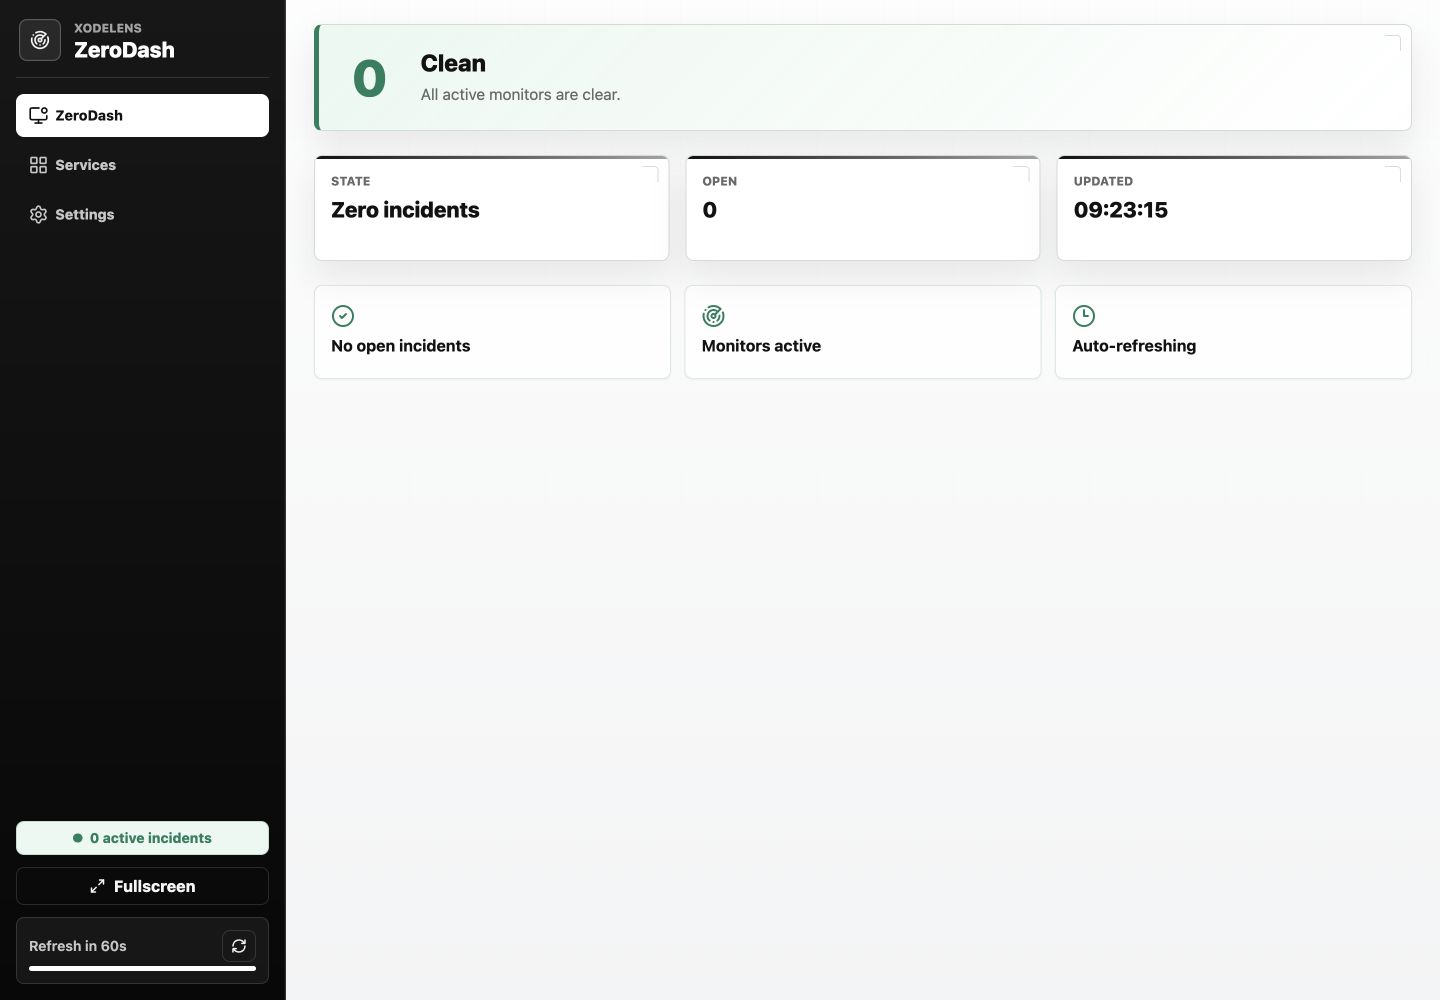
ZeroDash focuses the operations team on exception handling. When every monitor is clean, the interface stays quiet. When a check opens an incident, the active list becomes the next action queue.
MSP-ready shape
See which services are clear and which customer deployments need attention.
Open a service, review its checks, and move to the incident detail without hunting through admin screens.
Route selected checks to the channels and API endpoints your operations process already uses.
Contact
Reach out for product questions, support, deployment conversations, or to discuss whether XodeLens fits your MSP monitoring workflow.